Deforestation in the North?!
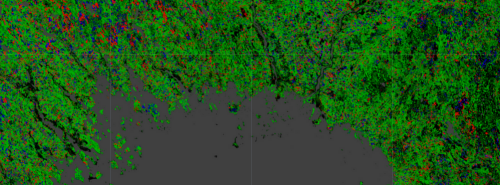
North end of Gulf of Bothnia. Red forest loss and blue forest gain (Global Forest Change)
By Dag Lindgren , retired professor of Forest Genetics at Swedish University of Agricultural Sciences, Umeå, Sweden.
A recent EPI (Environmental Performance Index) report from the Yale University ranks countries according to the ecosystem vitality of their forests which was estimated based on the change in tree cover between the years 2000 and 2012. Countries get ranked according to a scoring system. The best score is 100 (countries where tree cover was not reduced). The worst is 0. The Nordic and Baltic countries scored as follows: Denmark 19; Estonia 9; Finland 12; Latvia 3; Lithuania 24; Norway 32; Sweden 14. Iceland got no score. The other high latitude countries are Canada (score 17) and Russia (score 35). Thus, the message from EPI seems to be that there is deforestation and unsustainable forestry in the north!
These scores were based on the interpretation of satellite remote sensing results presented in a scientific article (Hansen et al 2013) published in Science. Pixels 30*30 m on all land surface were considered to indicate the presence of vegetation higher than five meters and with canopy cover more than 50% (=”forest”). Other pixels were interpreted as “non-forest”. This way, the gain and loss of “forest” between 2000 and2012 was estimated.
There are a number of reasons to doubt the EPI estimates:
1. EPI estimated the change in net forest cover based on gain and loss for tree cover based on Hansen et al 2013. The estimated net changes were not presented in this article, but they represent EPIs own interpretation. If Hansen et al 2013 had regarded it possible to use their results for calculating changes in net tree cover, they would certainly have done that. Loss was obtained for each individual year, while gain was based on the change in status for the whole period from 2000 to 2012. There is a bias in loss, gain and in particular in their difference. The net loss will be lower than estimated. Loss is a drastic sudden change (generally from logging operations) from one year to another, while gain is a slow accumulative process, which is not allocated to a single year and may not be stable (e.g. pre-commercial thinning may shortly change a “forest” to a “non-forest”). Gain and loss are not symmetric. The EPI estimates of forest cover changes are biased, the loss of forest cover is smaller than EPI suggests. But this bias seems too small to be the main explanation for the net loss estimated, in particular for the slow growing forests in the north.
2. None of the high latitude countries have a reduced forest area according to data published by FAO and UNEP. E.g. for the changes from 2005-2010 or 1990-2005 . This contrasts sharply to the EPI estimates, where all high latitude countries are claimed to suffer a considerable reduction of tree cover.
3. Among possible explanations for a decrease in forest cover is the change in land use (mainly to agriculture, urbanization and developments), but as the area used for forestry has not sunk in the concerned countries according to FAO and UNEP, these explanations can be excluded.
4. Events like forest fires, wind-slashing and insect pest attacks may cause tree cover loss. But this loss is not permanent. Sooner or later forests will reoccur on those areas again. Thus, losses and gains at a steady rate of disaster would not be expected to change the area of tree cover.
5. Logging is most likely the major cause of tree cover loss in the Nordic and Baltic countries. But logged areas generally - sooner or later - develop new tree cover. Thus, at constant annual area of final-felling, logging is not expected to cause reduced tree cover, except the part of logging connected to changed land use. However, the area used for forestry is not reduced in any considered country. If clear-felled areas increase by time it may cause reduction in tree cover. In Sweden the clear-felled area was higher than now five decades ago, but the last three decades final felling has been steady . Thus, for Sweden, logging operations cannot be considered as an explanation.
6. A comment appeared to the Science article. The comment specified loss and gain estimated by Swedish scientists based on the current best Swedish knowledge. No objection to the comment appeared.
Below the loss and gain for Sweden (square kilometers between 2000 and 2012 )from these two information sources are compared:
Hansen et al 2013 (Table S3) Fridman & Olsson 2014
Loss 25 533................................................ 24 716
Gain 15 281................................................. 23 838
In the Swedish estimate the gain was much higher than in the satellite based estimate, and near the loss expected if loss was constant over time.
7. According to Swedish law, the land owner is obliged to reforest after logging and to ensure the successful establishment of the new forest. If “gain” really were low compared to “loss”, it would have attracted wide attention. Sustainability is an important principle in Swedish forestry, doubts if that is the case would be noticeable.
8. Pixels are classified by Landsat, but the observations are neither canopy cover nor height. To convert the Landsat light reflection observations to pixel state, algorithms which are neither transparent (“black box”) nor exact are involved. The suggested process give results which seem conflicting with more established “knowledge” and difficult to accept. I would like to see better argumentations and real world comparisons before too much trust was given to the satellite data discussed here.
9. That all high latitude countries seem to loose forest cover may be caused by systematic errors in the interpretation algorithms, which could have difficulties to handle that the sun is far from zenith, long shadow length, short vegetation period, slow growth, long rotation time, variable canopy cover during seasons (e.g. leaf drop), snow cover etc. Such bias of data would have a joint effect on the observations in all these high latitude countries.
10. Anyone interested can check how well the satellite based world-wide examination fits to local realities. The pixels are publically available as layers on Google Earth (see picture above) or Global Forest Watch . There is even an available programming language for own evaluations of the pixels! Those responsible for these data and management tools deserve heaps of credit for this! It is just to look, which I have done. My impression is that the potential is huge, but the current pixel classification seems not accurate enough to present forest cover change statistics in the way done by e.g. EPI.
The methodology with global satellite remote sensing has large potential and advantages. Global comparisons and evaluations are important, and it is more or less impossible to merge nationally compiled information. Nations have their own definitions and national forest registries which do not necessarily cover the whole national area and thus miss some tree covered areas. The quality of national statistics is highly variable. National statistics have errors and uncertainties. Comparisons of national data with global data may help identify some of these weak points. Nations and people have to accept that global satellite remote sensing data is becoming increasingly important. The technique in itself, its reliability and comparability with national systems and the overall trustworthiness of satellite evaluations must improve. This article proves that the current situation is far from acceptable!
The current global analysis uses a definition of “tree cover” (vegetation height above 5 m and canopy cover over 50%), which is not easy compatible with national statistics. It is challenging for the readers to give explanations on why satellite data suggests that forest cover decreases in the north, while the FAO type of inventories suggest the opposite. In addition to what is discussed above, I thought of some factors which may look like a reduction of tree cover even if in reality the forest area and final felling are the same:
1. Growing short rotation energy crops in agriculture give more loss than gain and occur on agricultural land, which may not be included in forest statistics.
2. Reduced tree cover on “agroforestry land” classified as agriculture.
3. Unusual occurrence of events like storms 2000-2012 (for Sweden in particular the storm “Gudrun”. Most of these “losses” appear as logging in the Swedish statistics).
4. Clear-cuts become small with less straight borders and more trees are left. This means that parts of the pixels get less uniform.
5. Change in regeneration methods causing increasing delay between final cutting and the appearance of the new forest.
6. Changes in different types of gardens, which are not classified as forest land.
7. Unreliable and irrelevant country statistics.
8. There are many other possibilities, but difficult to consider as important.
Each suggested explanation seems able to influence far too little to explain the suggested forest reduction in Sweden. Some possibilities should not be interpreted as deforestation, and some will not reduce the forest cover further. I do not completely rule out that a combination of factors related to actual tree cover could explain the satellite results for Sweden, if seen as an isolated case. But as similar forest reductions were suggested for all high latitude countries, additional reasons are likely, like inefficient interpretation of satellite information.
A longer text on this topic can be found HERE


")
Comments
Post new comment